from SubArcticTundra@lemmy.ml to nostupidquestions@lemmy.ca on 08 May 2026 03:17
https://lemmy.ml/post/47020558
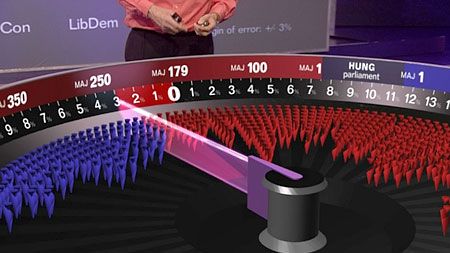
It’s a method of predicting what the result of an election will be whilst still waiting for all constituencies to publish results. You put all the seats on a scale (see above), sorting them by the margin by which they were won in the previous election. So it’ll go eg. 10% Blue -> 1% Blue -> 1% Red -> 10% Red. As the constituency results start coming out, you start to get an approximation of what the average change in vote across the nation is. You adjust the swingometer dial to reflect that, and the seats the dial passes are the ones that would get flipped if the vote swing was even across the country. Thus giving you a rough approximation of their number.
I was googling to see if America did this too but it seems to be just a UK thing.
#nostupidquestions
threaded - newest
Seems like a lot of data required for that. Probably a lot easier in the UK, a lot smaller.
“Sorry, we couldn’t figure out who is to become the next US president, the country is simply too big!”
I guess we just prefer that information presented with shaded maps and bar graphs. It’s probably for the same reason we don’t put a ‘u’ in “color” or “favorite.”
<img alt="" src="https://sh.itjust.works/pictrs/image/622a3721-30c3-4773-abb3-b4ec6f7b2fa8.png">
I hate that kind of map because it doesn’t clearly show how our elections actually work. This is much more clear.
<img alt="1000058105" src="https://lemmy.world/pictrs/image/74e9724e-eaaf-4d64-bc3a-a9d8cd4f6eb0.jpeg">
And depressing.